As is the case in any growing proposition, keeping an eye on the business activity and being nimble becomes the modus operandi. This is true of SLASTO’s rapidly expanding AABS service. With its promised goal of expediency and procedural fairness, is the LAT being overtaken by events?
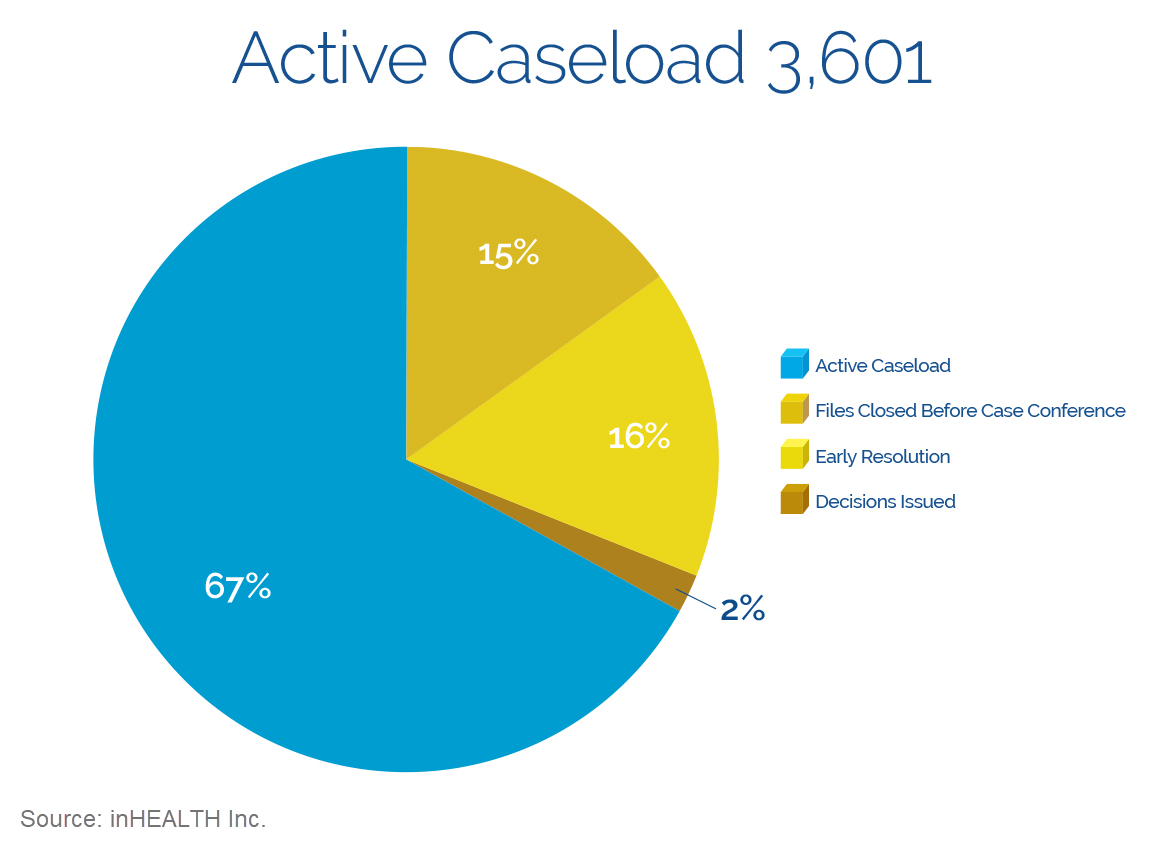
The recently released quarterly statistics have shown steady growth in LAT applications with productivity improvements throughout 2017 but not at the rate required in order to keep up with the incoming applications, resulting in a significant growth in their active caseload.

Applications to Active Caseload
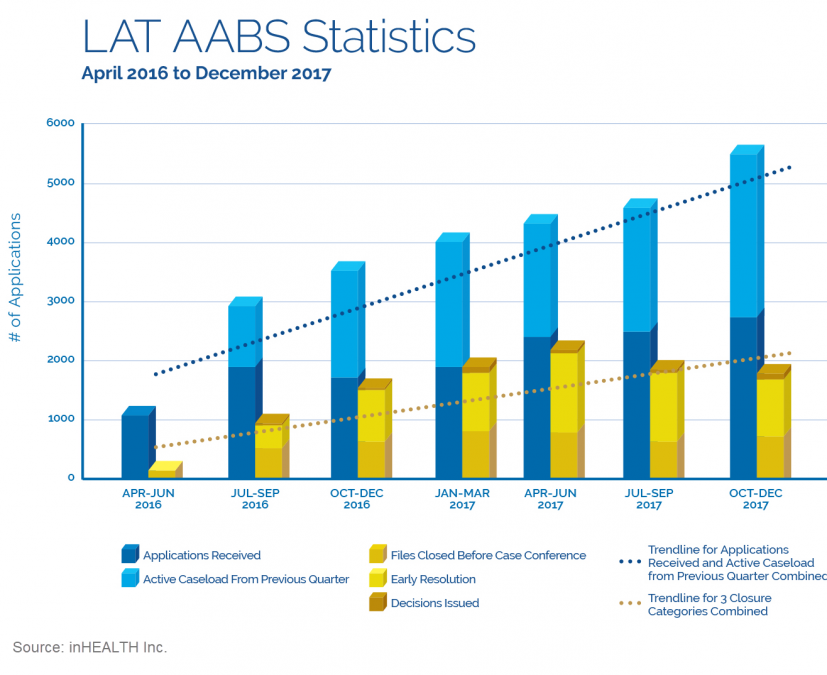
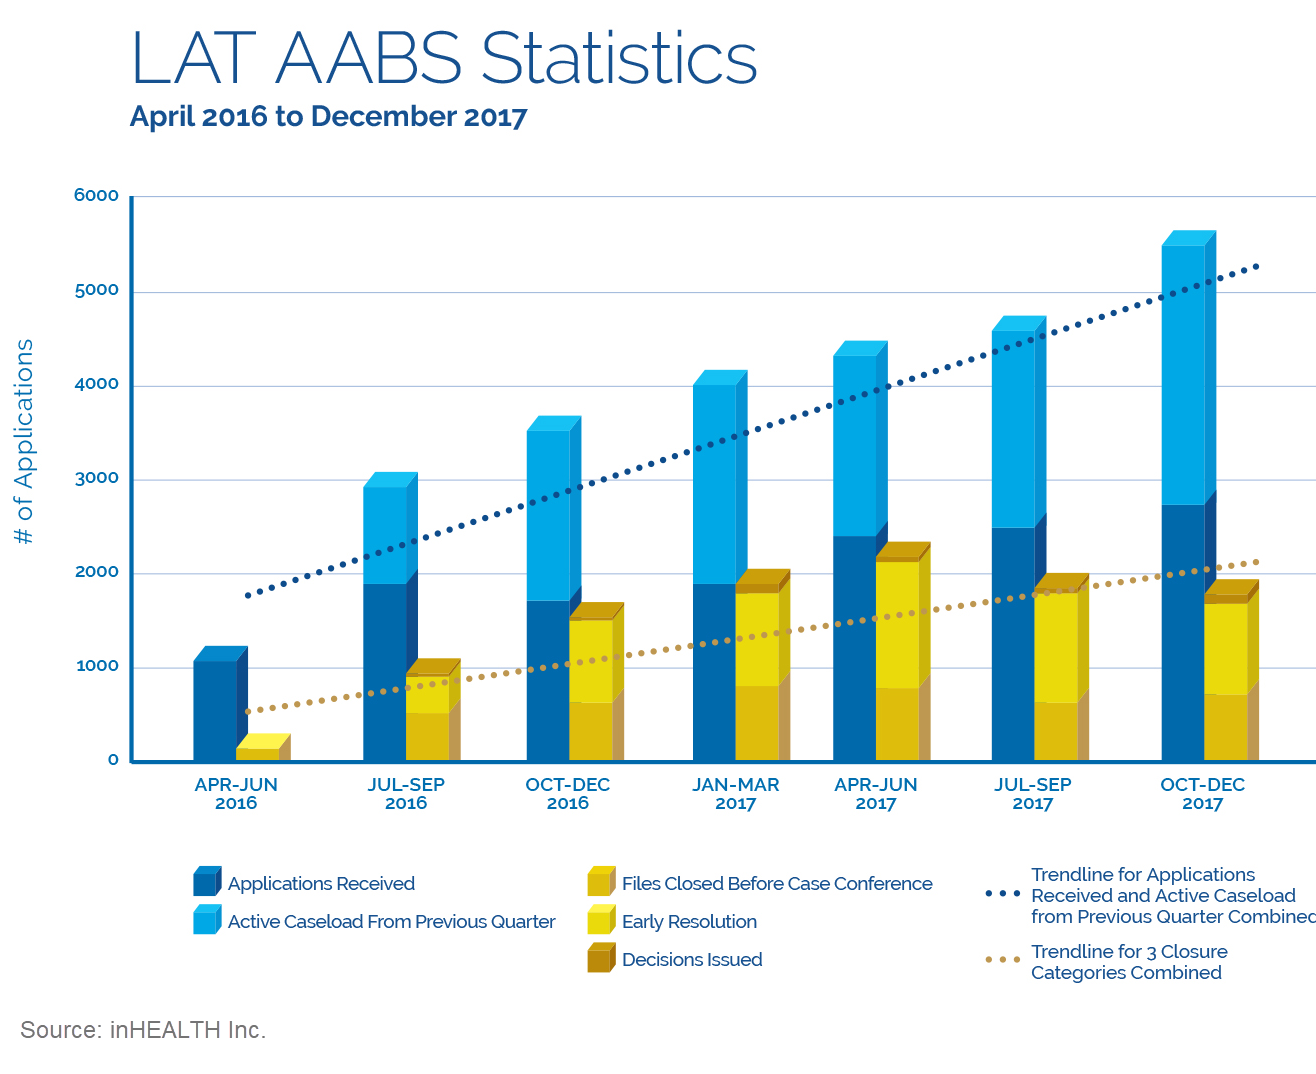
The statistics provided by the LAT are displayed in the graph below. The growth is best depicted in comparing the 1,704 applications received from October to December 2016, to the 2,717 applications received in the same period in 2017, showing an increase of 60%.
The growth in applications is outpaced by the growth in active caseload. The trend became more pronounced at the beginning of April 2017 with an active caseload of 2,080, which then increased by 73% to 3,601 by the end of 2017.
Where are the files being held up?
The metrics provided show that the LAT made strides in resolving files throughout 2017; however, the efforts started to take a turn in the later part of 2017. The mechanisms used to characterize files closed shows the changes and at the same time, give rise to other questions. To try and understand this, we take a closer look at the LAT statistics surrounding the following:
- Resolution Rates
- Active Caseload
- Hearing to Decision
Resolution Rates
According to the Data Dictionary published by the LAT, files closed are characterized in three categories:
- Files Closed Before Case Conference: Files that are closed without Tribunal’s adjudicative intervention. This includes any files closed administratively, dismissed, withdrawn or settled before a case conference
- Early Resolution: Cases that resolved (withdrawals or settlements) after a case conference but before a hearing, and;
- Decisions Issued: Number of decisions issued to parties after a hearing event
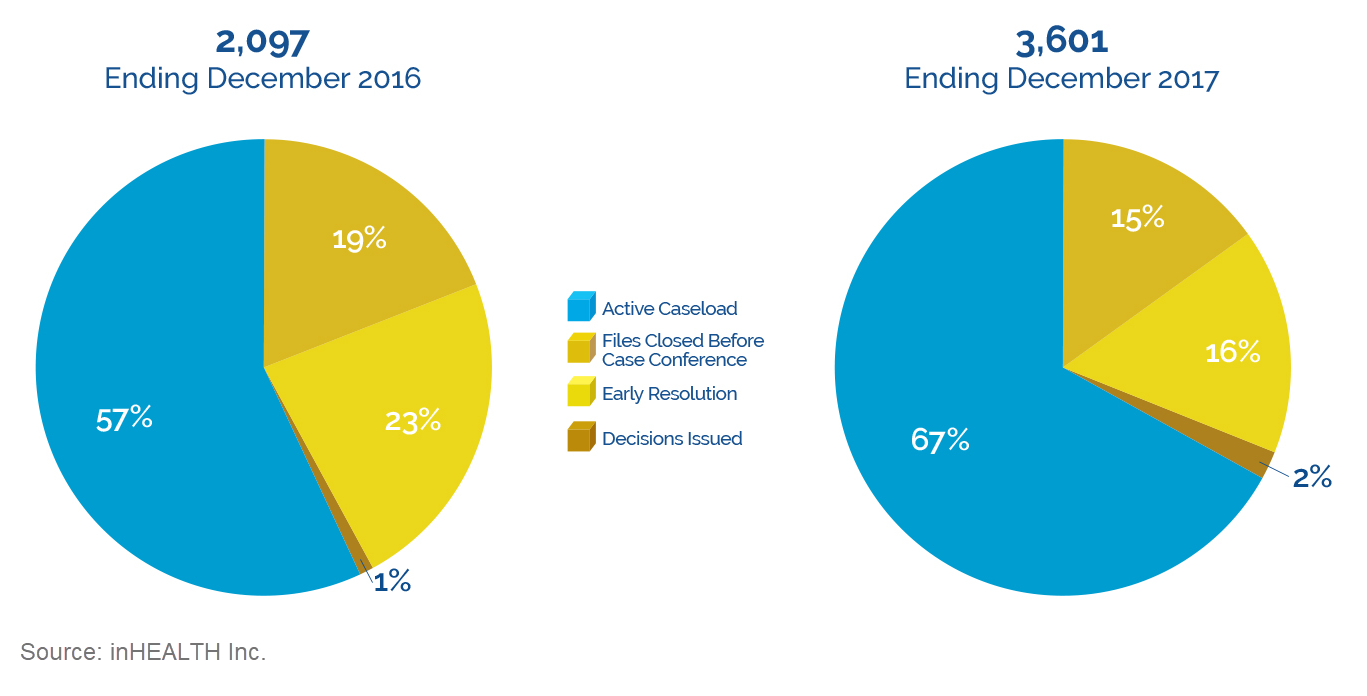
In comparing year over year, the LAT has increased productivity with respect to Files Closed Before Case Conference, Early Resolution, and Decisions Issued.
Change in Resolution Rates
However, there has been a decrease in the percentages of both the Files Closed Before Case Conference and Early Resolution compared to total applications. When comparing October to December 2016 to October to December 2017, this accounts, at least in part, for the increase in active caseload.
Impact of Resolution Rates
By the end of March 2017, there was a change in the impact of Files Closed Before Case Conference and Early Resolution, where those numbers started to deteriorate. The delta between applications to active caseload increases by 45. This trend continued in succeeding quarters, with further impact to the active caseload of 230, 530 and 1,015 respectively.

Increasing Active Caseload
Despite clear evidence of increased productivity, the active caseload started to rise quarter over quarter beginning April 2017. This suggests that files are staying in the system longer than originally proposed.

What we don’t know
The metrics provided do not include a number of essential variables to help us understand where in the process the active caseload is allocated. For example:
- Number of applications pending case conferences
- Number of applications pending hearings
- Number of applications pending decisions
Hearing to Decision
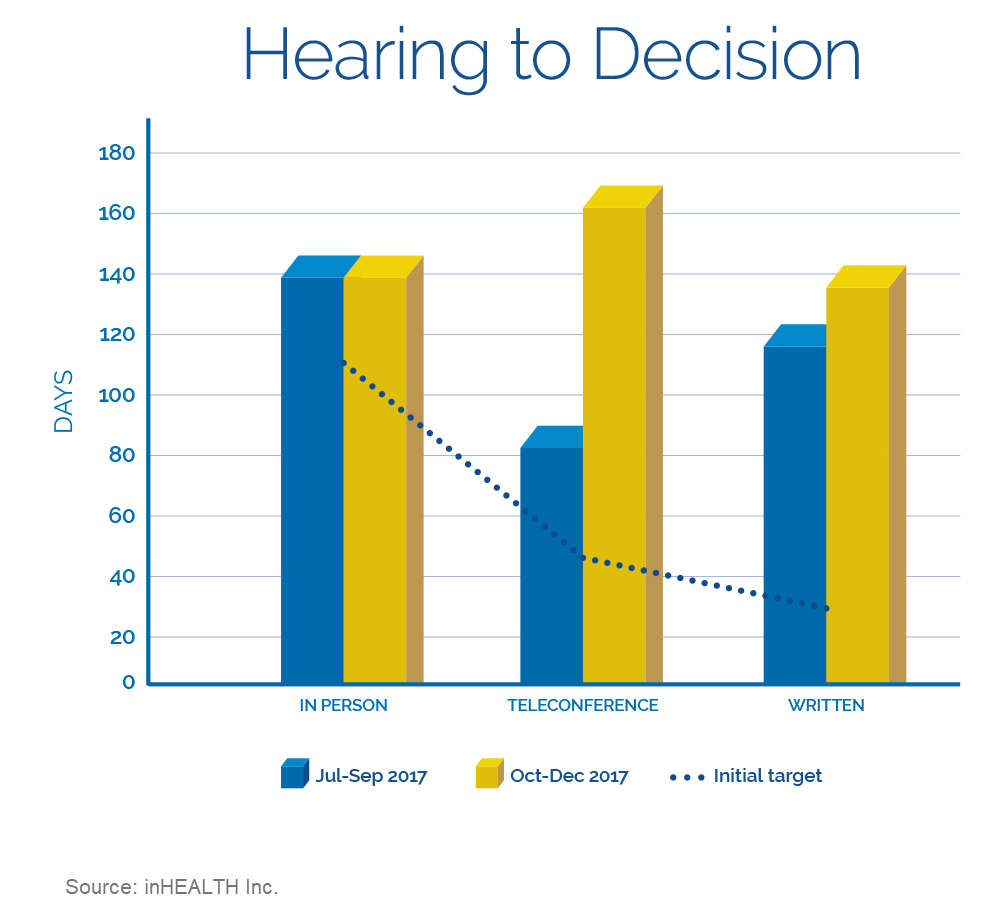
The LAT’s metrics with respect to key timelines from hearing to decision also show deterioration in decision turnover.
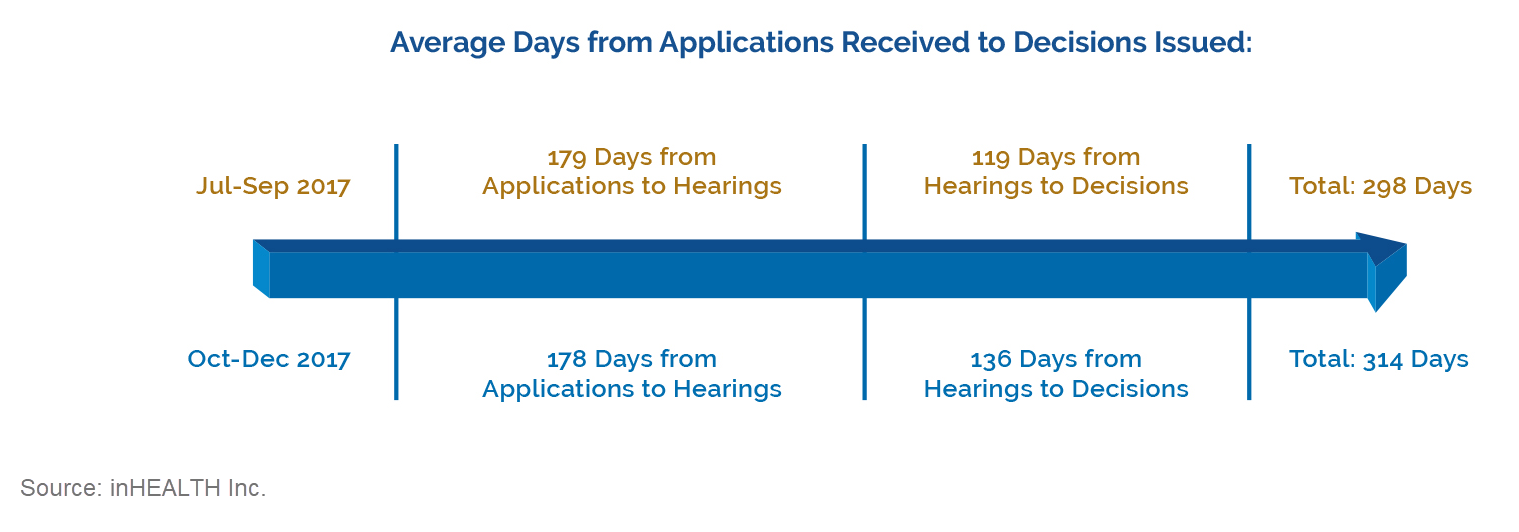
The targeted timeline from hearing to decision ranges between 30 to 90 days depending on the hearing types. With respect to in person and written hearings, the actual results are most telling. Regarding in person hearings, the actual stood at 138 days compared to a 60 to 90 days target in October to December 2017. Similarly, written hearings had an actual result of 134 days compared to a 30 days target in the same period.
Overtaken by Events
A couple of factors that could account for the increase in applications is the completed transition from FSCO and the 2 year limitation of files from April 1, 2016, which will likely drive a further increase in applications and active caseload.
Additional and timely access to metrics are needed to better understand where the files are being held up and how the LAT resources are being utilized. Given the current pace, it is difficult to forecast with any certainty whether these trends will continue or whether improvement is anticipated.
Should the stakeholders address the effectiveness of the process and whether the process, as currently constituted, can keep pace with the increased demand?
You can reach me at may@inhealth.ca or by phone at 416-364-6688 x2201
Visit us: http://inhealth.ca/compendium




Hello. Love your blog!.
One factor that should be considered is that the Insurance industry is emboldened by the changes to the Regulations and are abusing their power.
The LAT system was created because the Insurance didn’t like the decisions generated by FSCO. Where are the stats regarding favorable decisions towards the insurance companies? OTLA suggests that the vast majority of the results favor the insurance industry, so why wouldn’t adjuster deny treatment and thus forcing advocates to submit more disputes?
A more balanced analysis of these stats is required in order for them to be properly interpreted